Seller’s agent did a poor job = Your Chance for a Great Rental [code 689]

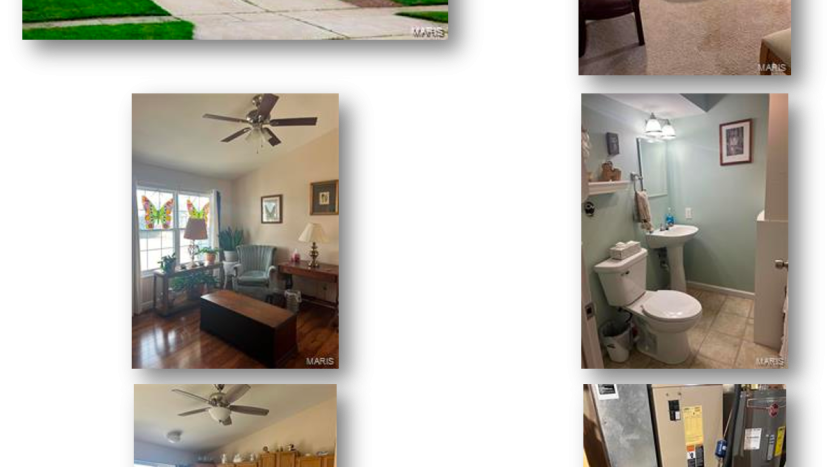
- Pictures from a phone, cluttered home, and not highlighting the space detracts most untrained buyers!
- Look closely and you'll see a kitchen in good shape, vaulted ceilings, a finished basement with over 600sqft that's not marketed, a new roof, and beautiful floors.
- The listing agent did not enter/calculate the finished lower level in total living area, so it's not 1043sqft, it's over 1600sqft!
- This home also is not allowing showings without proof of pre-approval. adding another hurdle for most buyers.
- Poor quality photos + low number of photos + inaccurate property description + extra hurdles for buyers = where YOU can take advantage and secure this investment property!
✅ Finished Basement
- Want more info – lest us know specific question or if you'd like to view the Excel
- Want to put an offer? Let us know and we'll contact you with Nathan
| A | Property Specifications | 1 |
| Bedrooms | 4 | |
| Bathrooms | 2.5 | |
| Square Feet | 1043+ | |
| Year Built | 1995 | |
| Garage Size | 2 | |
| Schools Rating (scale 3-30, 30 is best) | 22 | |
| Lot size (sq ft) | 4487 |
| B | Purchase Assumptions | My Offer |
| Offer used for analysis | $275,000 | |
| Suggested offer (low) | $275,000 | |
| Suggested offer (high) | $277,000 | |
| Asking | $280,000 | |
| Market Value (after improvements) | $285,000 | |
| Estimated Improvements (lower) | $5,000 | |
| Estimated Improvements (upper) | $8,000 | |
| Estimated Closing Costs | $2,750 | |
| Estimated Mortgage Costs | $2,214 | |
| *Other Fees At Closing (pts, . . . ) | $3,795 | |
| Total Cost (estimated) | $290,259 | |
| Original listing date | 1/20/24 | |
| DOM (days on market – TODAY) | 16 |
| D |
| $2,175 | $2,250 | $27,000 | |
| Rent (lower)* | $2,100 | $25,200 | |||
| Property Taxes | $210 | $2,520 | |||
| Insurance | $150 | $1,800 | |||
| Repairs | 75 | $100 | $1,200 | ||
| Property Management Monthly (%) | 7.5% | ||||
| Property Management Monthly ($) | $163 | $1,958 | |||
| Leasing Fee | 75% | $68.0 | $816 | ||
| HOA or Fixed Costs | $0 | $0 | |||
| Vacancy Rate | 4.0% | ||||
| Total Fixed Expenses | 35% | $772 | $9,259 | ||
| Total Expenses (Fixed + Mortgage) | $2,020 | $24,241 | |||
| 1 | Financial Analysis / Deal Attractiveness | |||||
| Years: | 5 | 10 | 15 | 20 | ||
| Cap Rate | 3.1% | 4.8% | 6.6% | 8.7% | ||
| Net Cash Flow | $15,165 | $46,497 | $96,759 | $169,178 | ||
| Equity Increase | $73,535 | $165,165 | $279,675 | $423,234 | ||
| Total Gain | $88,700 | $211,662 | $376,434 | $592,411 | ||
| Average Cash Flow/Year | $3,033 | $4,650 | $6,451 | $8,459 | ||
| Average Cash Flow/Month | $253 | $387 | $538 | $705 | ||
| Average Gain/Year | $17,740 | $21,166 | $25,096 | $29,621 | ||
| Average ROI | 90.7% | 216.5% | 385.1% | 606.0% | ||
| Annual ROI | 18.1% | 21.7% | 25.7% | 30.3% | ||
| Projected Property Value | $346,746 | $421,870 | $513,269 | $624,470 | ||
| 3 | Property Ratings Suggestions | |||||
| Item | Suggested Criteria (Min.) | This Property | FAVORABLE / INSUFFICIENT | |||
| Schools (scale of 3-30, 30 is the best) | 14 | 22 | FAVORABLE | |||
| Square Feet | 1,000 | 1043+ | FAVORABLE | |||
| Bedrooms | 3 | 4 | FAVORABLE | |||
| Bathrooms | 2 | 2.5 | FAVORABLE | |||
| Year Built | 1970 | 1995 | FAVORABLE | |||
| Average Cash Flow (at year 5) | $125 | $253 | FAVORABLE | |||
| Average ROI (at year 5) | 15% | 18.1% | FAVORABLE | |||
- 3.6% Median home price increased from 2022
- 1.5 month supply of inventory (has not changed much since 2020)
- 23 Days on market average (Same as 2022 average)
- 14% decrease in new listings from last year
| |||||||||
Disclaimer
Information contained herein was obtained from sources deemed reliable, however, Simply Do It and/or the owner(s) of the property make no guarantees, warranties or representation as to the completeness or accuracy thereof. The presentation of the property is offered subject to errors, omissions, changes in price and/or terms, prior sale or lease or removal from the market for any reason without notice.
The analysis is provided “As Is”. All the information is believed to be accurate (except for the small effects of some simplifying assumptions), but is not guaranteed, and depends on the values entered for the property. This analysis is intended for the purpose of illustrative projections. The information provided is not intended to replace or substitute for any legal, accounting, investment, real estate, tax, or other professional advice, consultation, or service. Simply Do It and/or the owner(s) are not responsible nor liable for any damages arising from the use of the analysis info.


